
The Website Optimization Process for 2026: A Field-Data-First Playbook
Master the website optimization process for 2026 with actionable steps that drive real results. Improve performance using field data!

The Website Optimization Process for 2026: A Field-Data-First Playbook

The website optimization process for 2026 involves six repeatable steps: audit, prioritize, implement, test, monitor, and iterate, run continuously using real-user data rather than relying solely on lab scores. If you do nothing else after reading this, run these first: fix your worst Largest Contentful Paint (LCP) image, break up long JavaScript tasks that delay Interaction to Next Paint (INP), stabilize layout shifts (CLS), strip any third-party script you can’t justify, and convert your heaviest images to modern formats. Do that, and you should see measurable field-data movement within a month.
Here’s the honest, no-fluff version of what to check first:
- LCP culprit: identify and preload the single largest above-the-fold image or font
- INP blockers: find JavaScript tasks over 50ms and split them
- CLS offenders: reserve space for ads, embeds, and web fonts before they load
- Dead weight: remove or defer third-party scripts (chat widgets, old analytics tags, unused pixels) that don’t earn their keep
- Image pipeline: convert to AVIF or WebP and serve responsive sizes
Pro Tip: Don’t trust a single Lighthouse run to tell you if you’re done. Google’s Core Web Vitals are scored at the 75th percentile of real Chrome users over a rolling 28-day window, so your fix might look perfect in the lab, and still take weeks to show up where it counts.
Key Takeaways
A durable website optimization process in 2026 depends on running audit, prioritize, implement, test, monitor, and iterate as a continuous loop validated by field data, not lab scores alone.
| Point | Details |
|---|---|
| Fix INP-blocking JavaScript first | Long tasks over 50ms hurt responsiveness more than almost any other single issue in 2026. |
| Trust field data over lab data | CrUX reports at p75 over a 28-day rolling window; wait for that window before declaring victory. |
| Prioritize templates, not pages | One template fix compounds across every page using it, unlike a single-page tweak. |
| Guard patient data in every test | Route RUM, chatbots, and personalization through PHI-free buckets on healthcare sites. |
| Get help when the team is stretched | Klyrmedia builds HIPAA-compliant, performance-first sites for healthcare providers who need this process run for them. |
Table of Contents
- What Changed About Website Optimization Process in 2026
- The 6-Step Website Optimization Process, Start to Finish
- Fixing Core Web Vitals: LCP, INP, and CLS in Practice
- Search Visibility Priorities for 2026 Site Optimization
- Running Experiments and Personalization Without Breaking Privacy
- Healthcare Considerations: HIPAA, Patient Data, and Accessibility
- Which Tools Belong in Your 2026 Optimization Stack
- How Long Website Optimization Takes and What It Costs
- Building a Prioritization Matrix for Your Optimization Backlog
- Measuring Success: KPIs, Dashboards, and Proving Impact
- What Actually Happens on Production Teams
- How KLYR Media Approaches Healthcare Website Optimization
- Sources
What Changed About Website Optimization Process in 2026
The biggest shift is that responsiveness now has teeth. Interaction to Next Paint replaced First Input Delay as the third Core Web Vital, measuring responsiveness across the entire lifespan of a page rather than only the first interaction. If your site has a bloated cart page, a sluggish filter panel, or a search bar that stutters on the fifth keystroke, INP will catch it. Web: avoid long tasks, cut unnecessary JavaScript, and stop shipping large rendering updates that block the main thread.
That single metric change rewired how performance teams prioritize work. Sites that spent years chasing a fast “time to interactive” number on page load are now discovering their real problem lives three clicks deep, in a JavaScript-heavy component nobody profiled because it wasn’t part of the initial paint.
“INP requires measuring interactions across the entire life of a page, and that often means Real User Monitoring that can attribute a slow interaction to a specific UI component. Without that, you’re guessing.” This is the core lesson from web.dev’s INP optimization guide, and it’s the reason lab tools alone can no longer carry a 2026 optimization program.
Field data has also become non-negotiable. The Chrome UX Report aggregates real Chrome sessions at the 75th percentile over a 28-day rolling window, and that field data, not a Lighthouse score, is what Google uses as a ranking signal. This means every change you ship has a built-in delay before you know whether it worked.
Two other forces are reshaping the process. Privacy-first personalization is replacing cookie-heavy segmentation with server-side logic and hashed identifiers, which changes how experimentation platforms build test cohorts. And edge rendering, serving HTML from a point closer to the visitor instead of a single origin server, is becoming a default lever for cutting Time to First Byte and improving LCP on global or multi-location sites.
The 6-Step Website Optimization Process, Start to Finish
Every durable optimization program runs on the same loop: audit, prioritize, implement, test, monitor, iterate. Treat it as a cycle you repeat quarterly, not a project you finish once.
- Audit. Pull field data from CrUX and PageSpeed Insights across your top templates (not individual pages), plus a Search Console crawl to find URL groups failing Core Web Vitals thresholds. Output: a scored list of pages/templates with their LCP, INP, and CLS status at p75.
- Prioritize. Score each fix by impact versus engineering effort. A template-level fix (say, the header component used on 40,000 pages) almost always beats a single high-traffic page fix. Output: a ranked backlog with owners assigned.
- Implement. Engineering ships the fix behind a feature flag where possible. Output: a merged change with a rollback plan documented before deploy, not after.
- Test. Validate in a canary environment or a percentage rollout, watching lab metrics for obvious regressions before full release. Output: a go/no-go decision with a defined rollback trigger.
- Monitor. Watch RUM dashboards daily for the first week, then weekly. Confirm the fix reflects in CrUX, remembering the 28-day rolling window before field data fully catches up. Output: a before/after comparison with p75 values.
- Iterate. Feed what you learned back into the next audit. Output: an updated backlog and a documented pattern (e.g., “always preload hero images on template X”) for future builds.
Here’s who typically owns each stage on a mixed team, including the compliance layer healthcare sites can’t skip:
| Step | Primary Owner | Supporting Roles |
|---|---|---|
| Audit | Performance engineer or SEO lead | Analytics, developer |
| Prioritize | Product owner | SEO, engineering lead |
| Implement | Frontend developer | Backend/edge engineer |
| Test | QA or developer | Product owner |
| Monitor | Analytics/RUM owner | Compliance (for patient-facing data) |
| Iterate | Product owner | Full team review |
When you’re deciding what to prioritize, sketch a simple two-axis graph: impact on the vertical axis, effort on the horizontal. Anything in the top-left quadrant (high impact, low effort) becomes next sprint’s ticket. Template-level fixes almost always earn a spot there because one change touches thousands of URLs at once, while single-page tweaks rarely justify the same sprint slot unless that page drives outsized revenue. This is consistent with the multi-pillar approach to modern optimization, which treats templates, not individual pages, as the unit of work.
For release strategy, feature flags let you ship code dark and turn it on for 5% of traffic before going wide. Canary deployments extend that logic to infrastructure changes. Define your rollback criteria before you ship, not while you’re staring at a spike in error rates at 11 p.m.
Fixing Core Web Vitals: LCP, INP, and CLS in Practice
Each Core Web Vital has a distinct root cause, and treating them as one generic “speed” problem is how teams waste sprints on the wrong fix.
LCP measures how long it takes the largest visible element (usually a hero image or heading) to render. The usual suspects are unoptimized images, render-blocking CSS, and slow server response times. INP measures the worst (technically, a near-worst percentile) delay between a user interaction and the next visual update. Long JavaScript tasks, heavy event handlers, and large DOM updates are the typical causes. CLS measures visual instability, images without dimensions, web fonts that swap in late, ads that push content down. Current guidance holds the line on thresholds: LCP at or under 2.5 seconds, INP at or under 200 milliseconds, and CLS at or under 0.1, all measured at p75.
The diagnostic workflow should move from broad to narrow. Start in Search Console’s Core Web Vitals report to find which URL groups are failing. Drop a sample URL into PageSpeed Insights to see both field data and a lab-based diagnosis. Then open Chrome DevTools or Lighthouse locally to step through the actual render timeline and pinpoint the offending script or asset.
The highest-impact fixes we see repeated across audits:
- Preload the hero image or font file that determines LCP, and serve it in modern efficient formats.
- Cache aggressively at the edge or CDN layer to improve server response time.
- Code-split JavaScript bundles so pages load only necessary code.
- Audit third-party scripts quarterly; a single unused chat widget can add noticeable blocking time.
- Break long tasks into smaller chunks using appropriate APIs to protect responsiveness.
A common before/after pattern: a hero image loading via a background CSS rule (discovered late by the browser) gets replaced with a preloaded <link rel="preload"> <img> tag. Teams regularly see LCP drop by a full second or more in lab testing, though the real confirmation comes from watching CrUX over the following weeks, not the immediate lab number.
Pro Tip: During a redesign, wrap new templates in a feature flag and run automated performance smoke tests against them before full rollout. Redesigns are the single most common source of Core Web Vitals regressions, because teams test functionality obsessively and performance almost never.
Search Visibility Priorities for 2026 Site Optimization
Search optimization in 2026 starts with matching page type to intent, not sprinkling keywords across a template. A product or service page should optimize for conversion intent. A blog post or resource page should optimize for acquisition, bringing in new visitors through informational search. A support or FAQ page should optimize for retention and reduced support load. Treating all three the same way is the fastest way to waste content budget.
On-page fundamentals still decide whether that intent-matched content actually ranks:
- Structured data (schema.org markup) for the page’s actual content type, not a generic default
- Clear entity signals in headings and body copy so search engines and AI answer engines understand what the page is about
- Logical header hierarchy: one H1, descriptive H2s that map to real subtopics
- Experience and expertise signals: author context, sourcing, and specificity over generic advice
- Clean canonical tags so duplicate or near-duplicate templates don’t split ranking signal
Measuring the impact of content changes requires patience and the right lens. Search Console’s impressions and click data will show ranking movement over two to four weeks. GA4 landing-page engagement metrics show whether visitors actually stick around once they arrive. If you’re running a controlled test on organic traffic (a genuinely tricky thing to isolate because you can’t A/B test what Google crawls), give it a full reporting cycle, at least 28 days, before drawing conclusions, mirroring the same rolling-window logic that governs Core Web Vitals field data.
Useful schema types to add depending on page type: FAQ schema for support content, HowTo schema for instructional content, and LocalBusiness schema for location or practice pages. None of this is a set-and-forget task. Build a content governance cadence, quarterly reviews for evergreen pages, monthly checks for anything tied to shifting regulations or pricing, so pages don’t quietly go stale while still ranking.
Running Experiments and Personalization Without Breaking Privacy
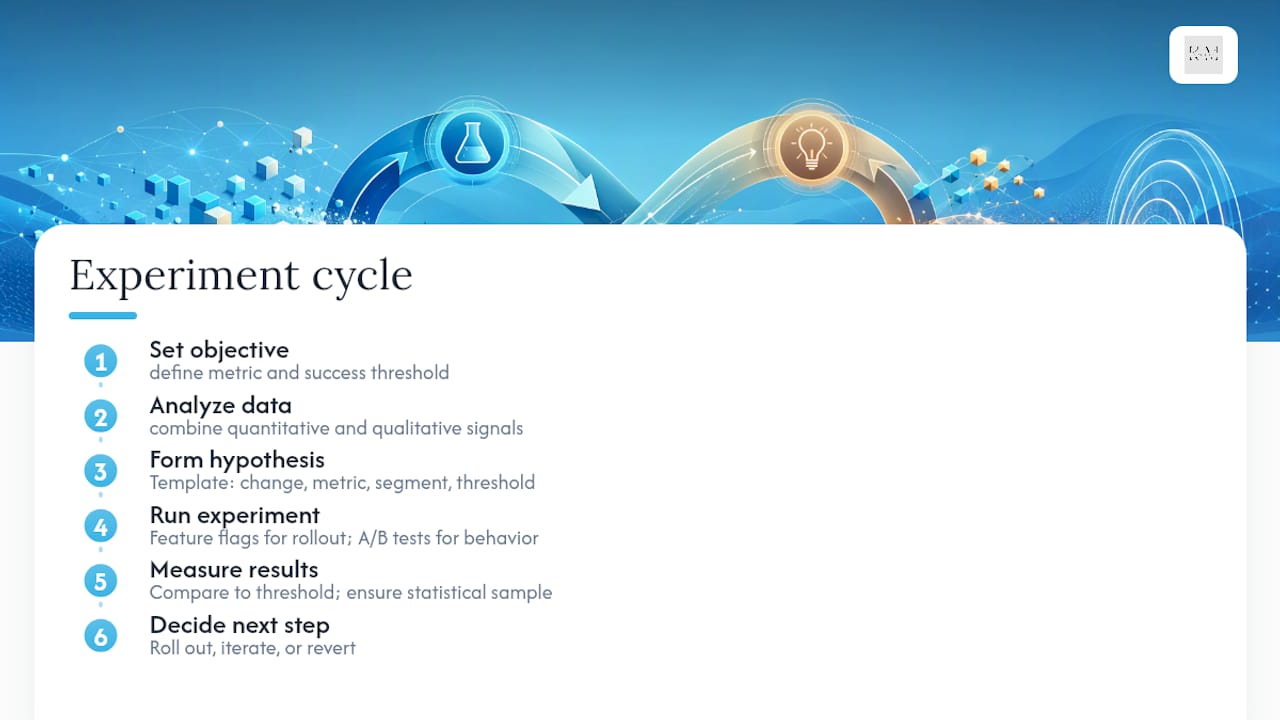
Every experiment needs a written hypothesis before it needs a tool. A solid template looks like this: “We believe [change] will improve [metric] for [segment] because [reasoning]. We’ll consider it successful if we see [threshold] within [timeframe].” Skipping this step is how teams end up running tests for months with no clear read on success.
Treat every optimization change as an experiment, not a one-off fix. The definitive guidance on this cycle is straightforward: set an objective, analyze data, form a hypothesis, run the experiment, then measure, and only then move to the next change.
Feature flags work well for gradual, low-risk rollouts where you’re mainly watching for technical regressions. Full A/B tests, run through an experimentation platform like Optimizely or Monetate, make more sense when you’re testing a genuine behavioral hypothesis (does a shorter form increase completions?) and need statistically defensible sample sizes before rolling out to everyone.
Privacy-first personalization looks different than it did a few years ago. Instead of client-side cookies tracking individuals across sessions, teams are shifting to server-side segmentation based on contextual signals (device, referral source, page path) and hashed identifiers that never expose raw personal data. This approach personalizes the experience without building a persistent profile of the visitor, which matters even more on regulated sites.
Combine qualitative and quantitative signals when building CRO hypotheses. Session replay tools and heatmaps show you where people hesitate or rage-click; your analytics platform tells you how many people are affected and what it’s costing you in conversions. Neither alone gives you the full picture.
On the UX checklist, the recurring offenders are always the same: forms with too many required fields, CTAs buried below the fold on mobile, and accessibility gaps (missing alt text, poor color contrast, unlabeled form inputs) that quietly cost both conversions and legal exposure.
Healthcare Considerations: HIPAA, Patient Data, and Accessibility
If you run a healthcare website, every tool in this article gets filtered through one extra question first: does this touch patient data? RUM tools, chatbots, session replay, and personalization engines all collect behavioral data, and on a healthcare site, that data can brush up against Protected Health Information (PHI) faster than teams expect.
- Route analytics and RUM collection through PHI-free buckets: track page paths and load times, never form field contents on intake or symptom pages.
- Review chatbot vendors for HIPAA business associate agreements before connecting them to anything resembling patient intake.
- Apply the same consent and data-minimization principle to personalization: segment by behavior and referral source, not by inferred health condition.
- Audit third-party scripts (chat widgets, ad pixels) specifically for what data they can see on appointment and patient-portal pages.
- Run WCAG 2.1 AA accessibility checks on every template, since accessibility gaps on healthcare sites carry outsized legal exposure alongside the conversion cost.
Trust signals matter more here than in almost any other vertical. A clear, plain-language privacy notice near intake forms, a visible and easy path to a phone number or contact form, and any relevant compliance certifications belong above the fold, not buried in a footer link nobody clicks.
Pro Tip: Set up a staging environment stocked with synthetic patient data for any experiment involving forms or intake flows. Testing with real patient records, even in a “safe” internal test, creates compliance risk that isn’t worth the convenience. For deeper guidance on this exact balance, see our breakdown of website optimization for healthcare and the feature checklist in top healthcare website features for medical practices.

Which Tools Belong in Your 2026 Optimization Stack
Tool sprawl is a real problem. Teams accumulate five monitoring dashboards that all measure a slightly different thing, and nobody trusts any of them. The fix isn’t more tools, it’s matching each tool to the specific job it’s actually good at.
- Lighthouse: your go-to for lab-based diagnosis during development, before code ships.
- PageSpeed Insights: combines lab data with real CrUX field data for a specific URL, useful for spot-checking a page after a fix.
- Chrome UX Report (CrUX): the source of truth for field performance at scale, queried through the CrUX API or BigQuery for template-wide trends.
- RUM platforms: continuous field monitoring that can attribute a slow interaction to a specific component, something neither Lighthouse nor CrUX alone can do.
- Experimentation platforms (Optimizely, Monetate): for structured A/B and multivariate testing with statistical rigor.
- Session replay and heatmap tools: qualitative context for why a metric moved, not a replacement for the quantitative numbers.
- CDN and edge logs: for diagnosing Time to First Byte issues that no browser-based tool can see.
For diagnostics, reach for Lighthouse. For field monitoring, CrUX and RUM. For validating a hypothesis before a full rollout, an experimentation platform. For anything happening upstream of the browser, your CDN’s log data. Google’s official CrUX methodology documentation is worth bookmarking directly, since vendor summaries of it drift over time.
Cost and scale matter here too. A small independent practice site doesn’t need an enterprise RUM platform with a five-figure annual contract; a lightweight RUM script paired with free CrUX API queries often covers 90% of the need. Save the heavier experimentation platform spend for sites with the traffic volume to reach statistical significance in a reasonable timeframe.
How Long Website Optimization Takes and What It Costs
Set expectations up front, because this is where most internal optimization programs lose executive buy-in. Quick wins (image compression, removing a dead script, adding cache headers) can ship in days and show lab improvement immediately, but still need the full 28-day CrUX window before you can call the field-data win confirmed. Template-level refactors (restructuring a component library, rebuilding a checkout flow) run weeks to a few months. Full redesigns or platform migrations run months, and often introduce temporary regressions before they stabilize.
| Project Type | Typical Timeline | Time to Reflect in CrUX |
|---|---|---|
| Quick wins (image/script fixes) | Days to 2 weeks | 28-day rolling window |
| Template-level refactor | 4 weeks | 28 days after full rollout |
| Full redesign or migration | 3 to 6 months | 28 days after stabilization |
Budget conversations should map directly to engineering hours, not vague retainer language. A quick-win sprint might need 20 to 40 developer hours. A template refactor easily runs several hundred hours across frontend and backend work. A full redesign is a multi-month engagement involving design, development, SEO, and QA in parallel.
Resourcing a real optimization program means covering these roles, even if some overlap on smaller teams:
- A frontend developer comfortable with performance APIs and bundling tools
- A performance engineer or senior developer who owns the Core Web Vitals scorecard
- An SEO lead who understands technical crawlability, not just keyword research
- An analytics owner who can build and maintain RUM dashboards
- A product owner who translates the impact-versus-effort backlog into sprint tickets
A realistic sprint cadence: two-week sprints for implementation work, with a standing weekly check on RUM dashboards and a monthly review of what’s actually moved in CrUX.
Building a Prioritization Matrix for Your Optimization Backlog
Every backlog eventually fills up faster than any team can execute it. The fix is a consistent scoring framework, not gut instinct, applied every time a new ticket gets proposed. Here’s how six common tickets typically stack up against each other:
Image optimization (convert to AVIF/WebP, add responsive sizes): high UX impact, low engineering cost, reflects in CrUX within the standard 28-day window, low risk, no privacy concerns. Usually the first ticket in any backlog.
Removing a heavy third-party script: high UX impact if the script is a known offender, low-to-medium engineering cost (mostly negotiation with whoever owns that vendor relationship), fast to reflect in field data, low technical debt risk, occasionally a privacy win if the script was a tracking pixel.
Preloading critical fonts: medium UX impact (mainly CLS and LCP), low engineering cost, fast to reflect in CrUX, low risk, no privacy constraints.
Breaking up long JavaScript tasks for INP: high UX impact on interaction-heavy pages, medium-to-high engineering cost depending on the codebase, moderate time to reflect since INP needs enough real interactions logged, moderate technical debt risk if done as a quick patch instead of a real refactor, no privacy concerns.
Rewriting cache rules at the CDN or edge layer: high UX impact (helps LCP and TTFB across the entire site), low-to-medium engineering cost, fast to reflect once propagated, low risk if tested in staging first, no privacy concerns.
Redesigning a lead or intake form: high revenue impact, medium-to-high engineering and design cost, slower to reflect since it needs a full conversion cycle to read results, moderate risk (forms are conversion-critical, so bugs are costly), and on healthcare sites, real privacy and compliance constraints around what data gets collected and how it’s validated.
Once scored, convert each ticket into a sprintable unit with a clear owner and success metric attached. Anything scoring low on impact and high on effort gets parked in a “revisit later” backlog rather than deleted, priorities shift, and today’s low-value ticket might become next quarter’s quick win once the underlying codebase changes.
Measuring Success: KPIs, Dashboards, and Proving Impact
The KPIs that matter fall into two buckets: performance and business outcome. On the performance side, track Core Web Vitals at p75 (LCP, INP, CLS) segmented by device type and connection speed, since a fix that helps desktop users can do nothing for someone on a slow mobile connection. On the business side, track page-level conversion rate, bounce or engagement rate, and, where relevant, load distribution across devices to spot which segment needs attention next.
Build your dashboard around a simple structure: a weekly health check pulling RUM data for anomalies, a monthly template-level review comparing CrUX trends against your backlog of shipped fixes, and a quarterly strategy session that looks at the bigger picture, is the optimization program actually moving business metrics, or just lab scores?
Proving causation, not just correlation, requires discipline. Launch changes in a controlled way (canary rollout or feature flag), annotate your dashboards with the exact release date and what shipped, and then reconcile RUM data against CrUX once the 28-day window closes. If your RUM data shows improvement but CrUX hasn’t caught up yet, that’s expected, not a failure, the two data sources are simply on different clocks. This reconciliation habit is also what separates teams who can defend their work to leadership from teams who get asked “did that project even do anything?” three months later.
What Actually Happens on Production Teams
Here’s what the process documentation doesn’t always capture: real teams are risk-averse, and rightly so. Nobody wants to be the developer whose “quick performance fix” took down checkout for six hours. That’s why the process above leans so hard on feature flags, canary rollouts, and defined rollback criteria, not because they’re best practice buzzwords, but because they’re what let a team ship fast without betting the business on every change.
The trade-off between speed and feature completeness shows up constantly. A team will identify that a bloated third-party script is hurting INP, and the honest conversation isn’t “remove it,” it’s “can marketing live without the live chat widget on mobile for two weeks while we find a lighter alternative?” Optimization work rarely happens in a vacuum; it happens in negotiation with whoever owns the feature you’re trying to trim.
Template-level fixes win over page-level fixes almost every time, not because page-level work doesn’t matter, but because engineering time is finite and a template fix compounds across every page using it. Teams that chase individual page scores instead of template health end up with a backlog that never shrinks, because they’re treating symptoms instead of the underlying component.
On governance, the teams that actually sustain performance gains over time have a release policy with real teeth: a performance budget attached to CI/CD (builds fail if a bundle grows past a set threshold), and a QA gate that checks Core Web Vitals impact before, not after, a feature ships to 100% of traffic. Without that gate, every redesign eventually erodes the gains from the last optimization cycle.
How KLYR Media Approaches Healthcare Website Optimization
Independent pharmacies and clinics don’t have the in-house team to run a six-step optimization loop alongside HIPAA compliance review, and that’s exactly the gap Klyrmedia was built to close. We handle the technical performance work (Core Web Vitals, edge caching, image pipelines), the local SEO and search visibility layer, and the conversion and analytics tracking, all built around patient-data handling from the start instead of retrofitted after a compliance scare.
What that looks like in practice for the practices we work with:
- Faster-loading appointment and intake pages, measured against real field data, not just a Lighthouse screenshot
- Fewer form drop-offs on booking and contact flows through friction audits and privacy-conscious personalization
- Improved appointment booking volume tracked through analytics dashboards built specifically for healthcare conversion paths
If your practice’s website is slow, hard to book through, or built on a platform nobody trusts with patient data, start with our HIPAA-compliant website design service, it’s the foundation everything else in this article assumes you have in place. Reach out for a site review and we’ll tell you exactly which of the fixes above would move the needle fastest for your practice.
Sources
The sources below cover the official methodology and practical mechanics behind everything in this article, worth bookmarking directly rather than relying on secondhand summaries.
- Web
- Chrome UX Report (CrUX) methodology
- Field data vs lab data: explanation and workflow | PerfMasters
For more on applying these principles specifically to regulated healthcare sites, see Klyrmedia’s guides on medical website design and mobile-friendly healthcare sites, or reach out directly for a walkthrough of where your site stands today.
Recommended
- Website Optimization for Financial Services: Build Trust & Generate Qualified Leads | Blog
- Website Optimization for Construction: Showcase Projects & Generate Leads | Blog
- Website Optimization for Real Estate: Convert More Visitors into Qualified Leads | Blog
- Website Optimization for Pharmacies: Drive More Online Prescription Transfers | Blog

