
7 Examples of Predictive Analytics in Healthcare That Save Money
Discover how predictive analytics in healthcare saves money by reducing no-shows, optimizing staffing, and improving patient retention.

7 Examples of Predictive Analytics in Healthcare That Save Money

Predictive analytics can cut no-shows, optimize your daily capacity, and flag which patients are about to walk out the door before they actually do. Here are the concrete examples worth building into an independent pharmacy or clinic this year.
No-show prediction flags high-risk appointments so you can send targeted reminders or overbook smartly. Demand forecasting predicts your daily patient volume so you staff right, not blind. Churn scoring catches patients drifting away 60 to 90 days before they leave for good. Refill and adherence prediction tells you who’s about to run out of medication before they call in a panic. Inventory and staffing forecasting turns predicted appointment volume into reorder points and shift schedules. Marketing and lead scoring ranks which prospective patients are worth the ad spend.
- No-show models built on prior visit history and lead time have hit an AUC of 0.92 in outpatient settings.
- Primary care no-show rates commonly run 23% to 33% nationally, higher in underserved areas.
Pro Tip: Start with whichever example maps to your biggest headache right now. A pharmacy bleeding refill revenue should build adherence prediction first, not a fancy marketing model nobody asked for.
The rest of this guide walks through how each one works, what it takes to stand up, and how to prove it’s paying for itself.
Key Takeaways
Predictive analytics pays off fastest in independent practices when it targets operational leaks, no-shows, churn, and refills, before it targets clinical prediction.
| Point | Details |
|---|---|
| Start with no-shows | No-show models built on prior history and lead time have reached an AUC of 0.92 in outpatient studies. |
| Run shadow mode first | Test predictions silently for 30 to 90 days before changing any scheduling or outreach workflow. |
| Catch churn early | Flag disengagement risk 60 to 90 days out, while there’s still time to run a real re-engagement sequence. |
| Keep integrations simple | Connect only your scheduler, reminder platform, and one dashboard; avoid manual data dumps. |
| Pilot with Klyrmedia | Klyrmedia runs a HIPAA-aware shadow analytics pilot on one use case before any workflow commitment. |
Table of Contents
- Examples of Predictive Analytics in Healthcare for Daily Operations
- How Small Practices Can Actually Implement This
- Measuring Whether Your Pilot Is Working
- Examples of Predictive Analytics for Early Diagnosis and Risk Stratification
- Predictive Analytics and Hospital Readmission Risk
- Predictive Modeling for Personalized Treatment Plans
- Connecting Predictive Analytics to Your Existing EHR
- Common Challenges in Adopting Predictive Analytics
- What Actually Moves the Needle for Independent Practices
- Run a Low-Risk Pilot Before You Commit to Anything
- Frequently Asked Questions
- Sources
Examples of Predictive Analytics in Healthcare for Daily Operations
Here’s where it gets practical. Each of these examples solves a specific bleed, and each one comes with a way to get started without hiring a data science team.
-
No-show risk prediction. The model looks at a patient’s past no-show history, how far out the appointment was booked, appointment type, and sometimes age or distance from the clinic. High-risk patients get an extra reminder call or a text 48 hours out instead of the standard one. Some practices go further and calibrate overbooking, filling the riskiest slots with a backup patient on a waitlist. Vendors like athenaConnect’s PAUL build practice-specific models this way, running the math against your own historical patterns rather than a generic national average.
-
Demand and appointment forecasting. This predicts how many patients you’ll actually see next Tuesday, not how many are booked. Historical patterns, seasonality (flu season, back-to-school physicals), and local events all feed into it. The payoff: you stop overstaffing slow Mondays and understaffing your Thursday rush. A clustering-based scheduling study found that grouping patients by predicted service time and demand pattern cut scheduling costs by roughly 15% compared to simple first-come-first-served booking.
-
Churn and retention scoring. Patients rarely announce they’re leaving. They just stop booking. A churn model watches for the early signs, longer gaps between visits, missed follow-ups, drop-off in refill pickups, and flags accounts 60 to 90 days before they’d otherwise be lost for good. That window matters. It’s long enough to run a real re-engagement sequence: a personal call, a reminder about overdue preventive care, or a note from the provider. Retention platforms that fold clinical and operational data together into one churn score, like Mazecare’s engagement module, pair the flag with an automated outreach workflow so nothing sits in a queue unattended.
-
Refill and medication adherence prediction. For pharmacies, this is often the single highest-leverage example on the list. The model predicts, based on days’ supply and pickup history, exactly when a patient will run out. Instead of hoping they remember to call, you auto-enroll them in a refill reminder or a medication synchronization program that lines up all their prescriptions to one pickup date. Fewer gaps in therapy, fewer late-night “can you fill this today” scrambles.
-
Inventory and staffing forecasting. Once you know predicted appointment or prescription volume, you can set smarter reorder triggers and shift schedules instead of guessing. A predictive analytics study in dental care found that Random Forest models integrated into resource planning improved chair utilization and cut operational costs, a pattern that translates directly to pharmacy inventory and clinic front-desk staffing.
-
Marketing and lead scoring. Not every inquiry is worth the same ad dollar. Lead scoring ranks prospective patients by predicted lifetime value and likelihood of actually booking, so your acquisition spend goes toward people who convert instead of tire-kickers who fill out a form and vanish.
How Small Practices Can Actually Implement This
You don’t need an in-house data team to pilot any of the examples above. You need a checklist and the discipline to run one use case at a time.
- Data checklist: pull scheduling exports from your EHR, point-of-sale data, and refill logs. That’s usually enough for a first model.
- Compliance checklist: keep protected health information in-house, or work only with vendors who sign a Business Associate Agreement. Favor FHIR-based or HIPAA-aware connectors over generic data pulls.
- Pilot design: pick one use case, set a 30 to 90 day baseline, and run the model in shadow mode, meaning it generates predictions but nobody acts on them yet.
- Integration points: hook the model into your scheduler or EHR, your reminder platform, and whatever marketing automation you already run.
- Ownership: name one person who reviews the risk scores daily and sets a clear rule for what action follows a “high risk” flag.
Pro Tip: Shadow mode is your friend here. Run the predictions silently for a month before you change a single workflow. It’s the cheapest way to find out if the model actually understands your patient population before you bet real staff time on it.
Practices that get this right usually treat their website and booking flow as part of the same system, since a forecast is only useful if patients can actually act on the reminder it triggers.
Measuring Whether Your Pilot Is Working
Track five numbers: no-show rate, appointment fill rate, revenue recovered from filled slots, patient retention or churn rate, and refill adherence rate.
- Set your baseline first. Pull 90 days of no-show data before you touch anything.
- Run the math. If your average visit is worth $150 and the model helps you recover 20 previously-missed appointments a month, that’s $3,000 in recovered revenue, before counting staff time saved.
- Test it properly. Run a shadow period or a simple A/B split between reminder groups, and watch for confounders like holiday weeks or a provider on leave skewing your numbers.
Interpretable models have flagged as much as 83% of no-shows correctly at the time of booking, with a low false-alarm rate, which is the benchmark worth aiming for once your pilot matures.
Examples of Predictive Analytics for Early Diagnosis and Risk Stratification
Most predictive analytics coverage online focuses here: models that flag disease risk, prioritize screenings, or stratify patients by clinical severity. That’s real, valuable work, and large health systems invest heavily in it.
It’s also not what this guide is about. Independent pharmacies and small clinics rarely have the volume, the specialist staff, or the budget to build clinical risk models from scratch, and honestly, that’s not where your fastest win sits anyway. Your patients don’t benefit from a sophisticated diagnostic risk score if half of them never show up to the appointment where that score would get used. The operational examples above, no-shows, demand, churn, refills, are the layer that makes everything else in your practice function. Get that layer right first. If you’re a multi-provider clinic exploring clinical-grade risk stratification down the line, that’s a conversation for your EHR vendor and your medical director, built on a different technology stack than the scheduling and retention tools covered here.
Predictive Analytics and Hospital Readmission Risk
Readmission risk scoring belongs mostly to hospitals and health systems managing discharge planning, not independent practices. It’s worth understanding, though, because the same operational discipline applies.
Hospitals use predictive models to flag which discharged patients are statistically likely to bounce back within 30 days, based on diagnosis, medication complexity, prior admission history, and social factors like transportation access. The intervention isn’t a diagnosis change. It’s a phone call, a follow-up appointment scheduled before discharge, or a home health referral.
If you run an independent clinic that partners with a hospital system, this matters to you indirectly: readmission-risk patients often land in your waiting room for a follow-up visit within days of discharge. Treat those referrals as your own version of a churn-risk flag. A patient discharged from the hospital last week who misses their follow-up with you is a patient at real risk of a return trip to the ER, not just a lost revenue slot.
Predictive Modeling for Personalized Treatment Plans
Personalized treatment planning uses predictive models to suggest which therapy, dosage, or care pathway is statistically most likely to work for a given patient profile, based on how similar patients responded in the past. Large health systems and specialty practices use this to reduce trial-and-error prescribing and shorten time to symptom relief.
For an independent practice, the more accessible version of this idea shows up in medication management. A pharmacy running adherence prediction can pair it with personalized refill timing, syncing a patient’s blood pressure medication and their diabetes prescription to the same pickup date instead of two separate trips. That’s not a clinical algorithm rewriting a treatment plan. It’s an operational nudge that makes the existing treatment plan easier to follow, which is often the bigger barrier to a good outcome anyway. The clinical version of personalized treatment modeling is a specialist-level investment; the adherence-support version is something a small pharmacy can build this quarter.
Connecting Predictive Analytics to Your Existing EHR
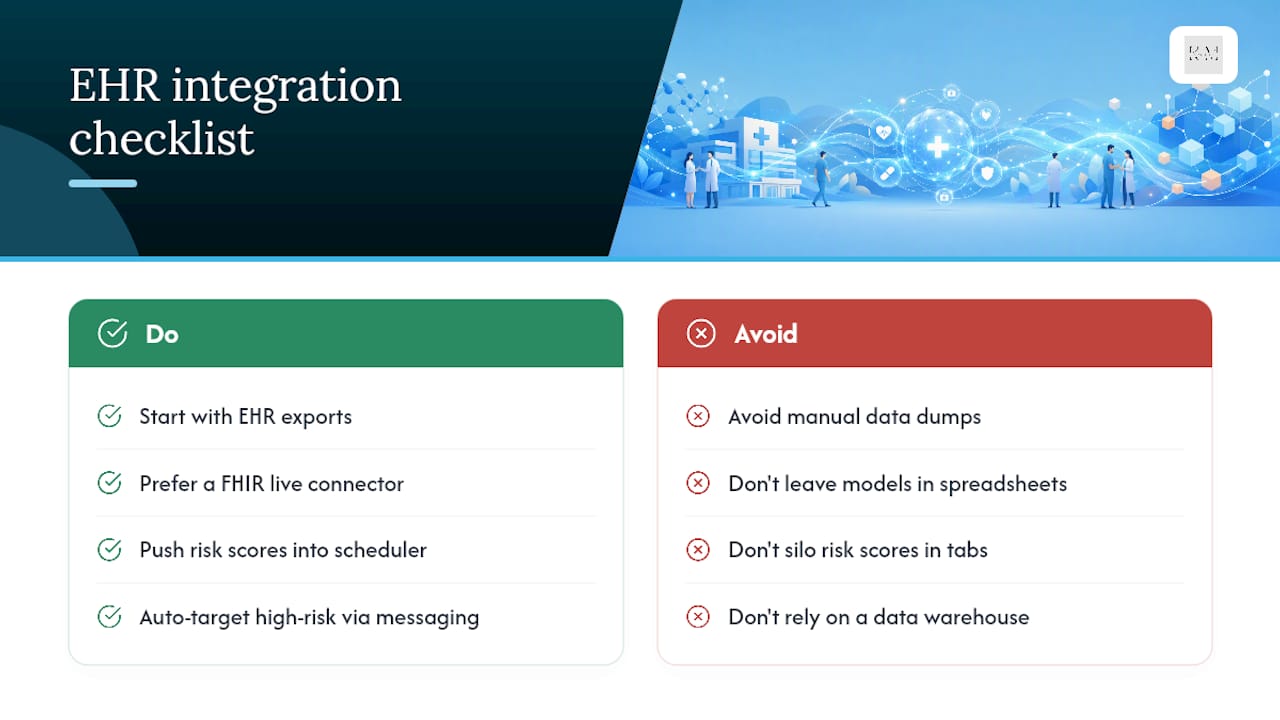
The model is worthless if it lives in a spreadsheet nobody checks. Integration is where most small-practice pilots actually fail, not the math.
Start with what your EHR already exports. Most systems can push scheduling data, appointment history, and basic demographics through a standard connector, ideally one built on the FHIR standard, which is quickly becoming the common language between EHRs and outside tools. Avoid any vendor that wants a manual data dump instead of a live connection. That’s a sign the integration will break the first time your schedule changes.
The practical integration points are: your scheduler (so risk scores show up next to the appointment, not in a separate tab), your reminder or messaging platform (so high-risk patients automatically get the extra touch), and a simple dashboard your front-desk lead checks each morning. You don’t need a data warehouse. You need three systems that talk to each other and one person accountable for acting on what they say. For a deeper look at how AI tools generally slot into a healthcare practice’s tech stack, Klyrmedia’s guide to AI in healthcare covers the broader landscape.
Common Challenges in Adopting Predictive Analytics
The math isn’t usually the problem. Getting a small team to trust and use a new number is.
Data quality trips up more pilots than bad algorithms do. If your scheduling data is messy, half-entered, or spread across three disconnected systems, no model can fix that on day one. Clean up your data sources before you pick a vendor.
Staff buy-in is the second wall. A front-desk team that’s been burned by “the computer said” tools before will ignore a risk score unless there’s a clear, simple action attached to it. Keep the first rule dead simple: high risk means an extra call, nothing more complicated.
Compliance anxiety stops a lot of practices before they start. The fix isn’t avoiding predictive tools, it’s choosing vendors who sign a Business Associate Agreement and keep patient data inside a HIPAA-compliant environment rather than a generic cloud tool never built for healthcare.
Cost concerns are usually overblown relative to the return. A shadow-mode pilot on one use case costs a fraction of what a single month of unaddressed no-shows costs a busy clinic.
What Actually Moves the Needle for Independent Practices
Most advice on this topic gets written for hospital systems with data science teams and six-figure software budgets, then gets awkwardly retrofitted for a five-provider clinic. That mismatch is why so many small practices assume predictive analytics isn’t for them.
It is, but only if you flip the priority order. Operational intelligence, no-shows, demand, churn, refills, tends to pay back faster than any clinical-outcome model, because the cost of the problem is concrete and immediate: an empty chair, a lapsed patient, a missed refill. You don’t need to prove clinical validity to a review board. You need one clean pilot, run in shadow mode, on the single leak costing you the most money right now.
The conventional advice to “start small” is right but usually too vague to act on. Start small means: one use case, 90 days of baseline data, one person owning the follow-up action. Skip the temptation to buy a platform that promises to do everything at once. That’s how pilots die in committee instead of producing a number you can show your team by the end of the quarter.
Run a Low-Risk Pilot Before You Commit to Anything
Klyrmedia builds the pilot instead of the pitch deck: a 30 to 90 day shadow analytics run on one use case, no workflow changes, no upfront platform commitment.
The engagement starts with a review of your existing data (scheduler exports, refill logs, whatever you’ve already got), a plan scoped to your practice, and a HIPAA-aware integration built under a signed Business Associate Agreement. You get a dashboard showing the risk scores in real time and a report at the end measuring the actual impact, recovered appointments, adherence lift, whatever your use case targets, before you decide whether to turn the recommendations into live action rules. If a dental-style resource-forecasting model fits your operation better than a scheduling one, partners like Avitra’s AI charting tools show what that pattern looks like in practice. Ready to see what a pilot would find in your own data? Start with Klyrmedia’s HIPAA-compliant web design and integration services and get a scoped plan back within days.
Frequently Asked Questions
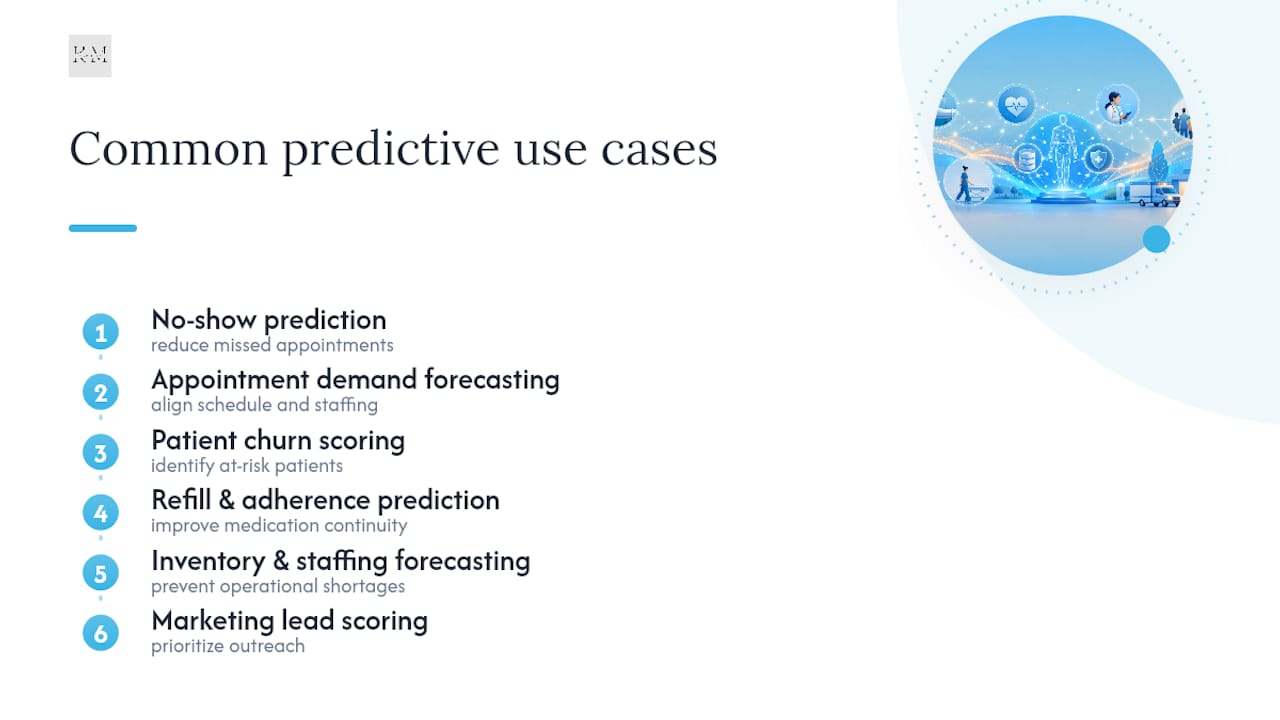
What are the most common examples of predictive analytics in healthcare for small practices? The highest-impact examples are no-show prediction, appointment demand forecasting, patient churn scoring, refill and adherence prediction, inventory and staffing forecasting, and marketing lead scoring. Each targets a specific operational leak rather than a clinical diagnosis.
How is predictive analytics different from a basic reminder system? A basic reminder system treats every patient the same. Predictive analytics ranks patients by actual risk, so a patient with three past no-shows gets a different intervention than one who’s never missed an appointment.
Do I need a data science team to use predictive analytics in my clinic? No. Most pilots start with data you already have in your EHR and point-of-sale system, run through a vendor or partner under a signed Business Associate Agreement, with one staff member reviewing the output.
How long does it take to see results from a predictive analytics pilot? Most shadow-mode pilots run 30 to 90 days before you introduce any action rules, with measurable results on no-show rate or refill adherence typically visible within the first full pilot cycle.
Is predictive analytics in healthcare HIPAA-compliant? It can be, provided patient data stays within a system covered by a Business Associate Agreement and the vendor uses HIPAA-aware infrastructure rather than a generic analytics tool never built for protected health information.
Sources
- athenahealth | athenaConnect
- npj Digital Medicine (Nature) — no-show prediction and interpretable models
- Optimizing dental care resources using predictive analytics (Zenodo DOI)

