
Fill Clinic Slots With Forecasts: Appointment Demand Forecasting
Practical, operations-first appointment demand forecasting for clinics. Turn weekly forecasts into staffing, slot rules, inventory orders, and fewer no-shows.

Fill Clinic Slots With Forecasts: Appointment Demand Forecasting

Use time-series baselines like SARIMA or Prophet as your foundation, then layer a gradient-boosting ensemble on top to catch what the baseline misses. Roll the forecast forward weekly, map the upper quantile to a staffing buffer, and update as new bookings land. That combination, not any single “best” model, is what actually holds up when patient volume swings on you.
TL;DR:
- Using a combination of time-series models and gradient-boosting ensembles provides robust demand forecasts that handle patient volume swings effectively.
- Accurate forecasting depends on selecting the correct demand label, such as scheduled bookings versus attendance, and building a dataset that includes appointment, operational, and external factors.
- Starting with simple benchmarks and validating models through rolling-origin backtesting ensures reliable predictions; staff should staff for the forecast’s upper quantile, not the median.
- Forecasts should be integrated into scheduling, staffing, and inventory systems, with automation and scenario planning to mitigate demand shocks and improve operational efficiency.
- Handling patient data responsibly requires strict privacy controls, careful feature selection, and clear data retention policies to maintain trust and compliance.
Table of Contents
- What Is Appointment Demand Forecasting, and Which Method Wins?
- What Data Do You Actually Need to Forecast Reliably?
- How Do You Test and Deploy a Forecasting Model?
- Turning Forecasts Into Staffing and Scheduling Rules
- What Does This Look Like in Practice?
- How Forecasts Connect to Inventory and Resource Planning
- Handling Patient Data Responsibly While You Forecast
- Why Most Forecasting Pilots Stall Before They Help Anyone
- Get Your Forecasting Pipeline Built and Connected
- Sources
What Is Appointment Demand Forecasting, and Which Method Wins?
Appointment demand forecasting is the practice of predicting how many patients will book, show up, or need care over a future window, using historical visit patterns, calendar effects, and outside signals like marketing pushes. Most clinics get this wrong by picking one model and trusting it blindly. The Armstrong and Green review of evidence-based forecasting methods identifies 17 methods with real predictive validity and pushes hard for combining several rather than betting on one.
Here’s how the main approaches actually stack up in a clinic setting:
- Time-series models (SARIMA, ETS, Prophet) work well when a clinic has stable weekly and seasonal rhythms, like flu-season spikes or predictable Monday surges. They’re cheap to run and easy to explain to a scheduling director who doesn’t want a black box.
- Regression with exogenous variables earns its place when demand isn’t just a function of the calendar. If a PPC campaign or a new referral partnership just launched, you need a model that can absorb that signal, not one that only looks backward.
- Global machine learning models (gradient boosting, LSTM-based approaches) shine when you’re forecasting across many similar clinic locations at once, since they borrow patterns from sister sites to sharpen predictions for smaller ones.
- Deep learning helps mainly at scale, across dozens of sites with long histories. For a single clinic or a small regional group, it usually adds complexity without adding accuracy.
A broad review of ML and deep learning demand forecasting methods found that machine learning tends to outperform pure statistical models on messy, non-linear demand, but only when the data pipeline and feature design are handled carefully. Skip that groundwork and the fancier model just overfits noise. The safest operational stance: build the time-series baseline first, then ensemble it with an ML layer, and let the two disagree with each other as a built-in sanity check.
What Data Do You Actually Need to Forecast Reliably?
Before any model matters, the label you choose matters more. Forecasting scheduled bookings answers a different question than forecasting attendance, and conflating the two is one of the most common mistakes operations teams make. If your capacity decision hinges on staffing the floor, forecast attendance. If it hinges on call-center load, forecast created bookings.
With that label locked in, build your dataset around these core elements:
- Appointment date, booking date, and lead time — the gap between when a patient books and when they’re seen shapes how far ahead you can act.
- Visit type and provider — a well visit and a same-day sick visit have completely different demand curves.
- Outcome flags — attended, no-show, canceled, and rescheduled, tagged consistently across every system that touches the appointment.
- Calendar and external features — holidays, school breaks, local events, weather, and marketing or referral pushes that create demand spikes.
- Operational metadata — clinician hours, blocked slots, and specialty mix, since a forecast is worthless if it ignores how many chairs were even open.
Inconsistent timestamps or missing no-show tags will quietly poison every model you build on top of this data, no matter how sophisticated the algorithm.
How Do You Test and Deploy a Forecasting Model?
Start small. Build a naive baseline, like last week’s average or a simple seasonal average, before you touch anything complex. That baseline is your floor. If a fancier model can’t beat it consistently, the fancier model isn’t earning its keep.
Test every candidate model using rolling-origin backtesting, where you repeatedly train on a growing historical window and validate on the next unseen period, mimicking exactly how the model will behave in production. A recent evaluation of forecasting methods for healthcare operations backs this approach as the standard for measuring whether a forecast-driven scheduling rule will actually hold up before you touch live schedules.
Judge the results with the right metric for the decision at hand:
- MAE (mean absolute error) for day-to-day capacity planning, since it reflects typical miss size in patients per day.
- RMSE when large, rare misses (a holiday weekend surge you didn’t see coming) carry outsized operational cost.
- Interval coverage to confirm your uncertainty bands are honest, not just narrow and reassuring.
Calibrate those intervals with split conformal methods, then staff to the upper quantile rather than the point forecast. An open-source clinic forecasting platform demonstrates this pattern directly, benchmarking over a dozen models and converting their conformal intervals into concrete staffing recommendations rather than leaving them as abstract statistics.
Pro Tip: Retrain weekly on a fixed schedule, but also set a drift trigger, such as a sustained rise in absolute error over two consecutive weeks, that forces an off-cycle retrain. Waiting for the calendar alone will leave you flying on a stale model during exactly the weeks it matters most.
Before rolling any forecast-driven rule into production, simulate it against last year’s actual demand. If the simulated staffing plan would have caused a bottleneck in August, you want to know that in a spreadsheet, not in a waiting room.
Turning Forecasts Into Staffing and Scheduling Rules
A forecast that never touches the schedule is just a chart. The real work is translating a predicted range into slot counts, staffing levels, and overbooking rules that front-desk teams can execute without a data science degree.
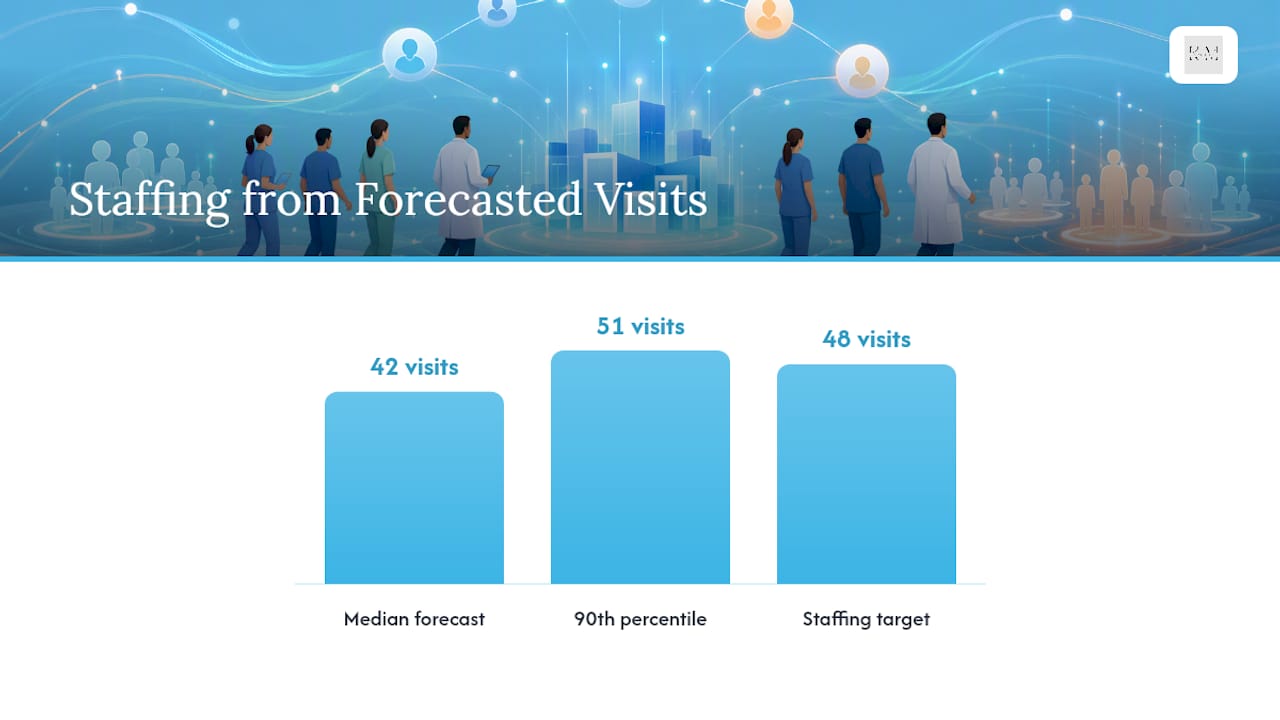
Map your model’s upper quantile, not the median, to your staffing buffer. If the median forecast says 42 visits but the 90th percentile says 51, staff for something closer to 48, not 42. Research on dynamic appointment scheduling with rolling-horizon forecasts found that integrating forecast updates directly with priority-specific access-time targets improved service levels in outpatient systems compared to static scheduling templates.
A few operational rules worth setting deliberately:
- Pooled versus reserved capacity: pooled slots maximize utilization but can starve urgent-priority patients; reserved capacity protects urgent access but sits empty when demand is soft. Most clinics need a blend, not an either/or.
- Overbooking calibrated to predicted no-show rate, not a flat percentage applied to every clinic regardless of its actual history.
- Scenario plans for demand shocks, especially the kind your own PPC campaigns or a referral push can trigger, so a marketing win doesn’t turn into a scheduling crisis.
Outpatient systems that combine forecasting with priority-specific access standards have shown measurable gains in service-level performance, according to that same scheduling research. Track your own performance with four numbers every week: access time (days to next available slot), fill rate, overtime hours, and provider utilization. If fill rate is climbing while access time also climbs, your forecast is underestimating demand, not your staff underperforming.
What Does This Look Like in Practice?
Klyrmedia builds HIPAA-compliant websites and automation systems for independent pharmacies and clinics, and demand forecasting rarely lives in a vacuum from that work. A Mayo Clinic case study on subspecialty-level demand forecasting showed that adjusting slot mix by subspecialty, rather than treating a whole department as one demand pool, cut neurology patient wait times measurably.
The same logic applies at the independent clinic level. When a forecast flags a projected surge, a clinic can pair that signal with automated reminder sequences and predictive no-show flags to reallocate slots before the surge hits, not after the waiting room backs up. That pairing, forecast plus follow-up automation working together, is where the operational payoff actually shows up.
How Forecasts Connect to Inventory and Resource Planning
Appointment demand doesn’t stop at the scheduling grid. Every projected visit spike implies a downstream resource need, and clinics that forecast appointments without forecasting supplies routinely get caught short.
Start by tying visit-type forecasts to consumption rates per visit type. A flu-shot surge predicted three weeks out should trigger a vaccine and supply reorder now, not when the fridge is empty. Feed your appointment forecast into whatever inventory or practice management system already tracks stock levels, using visit type as the shared key that links the two datasets.
Staffing is the second resource layer. Provider hours, medical assistant coverage, and even parking or check-in desk staffing all scale with predicted volume, and a forecast that only informs the appointment book while ignoring these adjacent resources leaves half the value on the table. Clinics running multiple locations benefit from a shared forecasting layer that reconciles site-level predictions against a regional total, so a supply order isn’t placed twice or missed entirely when demand shifts between nearby locations.
The practical fix is an integration layer, even a simple scheduled export, that pushes forecast outputs into whatever system manages consumables, equipment scheduling, and shift planning. Without that connection, forecasting stays a scheduling exercise instead of becoming an operations one.
Handling Patient Data Responsibly While You Forecast
Forecasting models run on patient-level data, appointment history, visit type, demographic patterns, and that means privacy discipline has to be built into the pipeline from day one, not bolted on afterward.
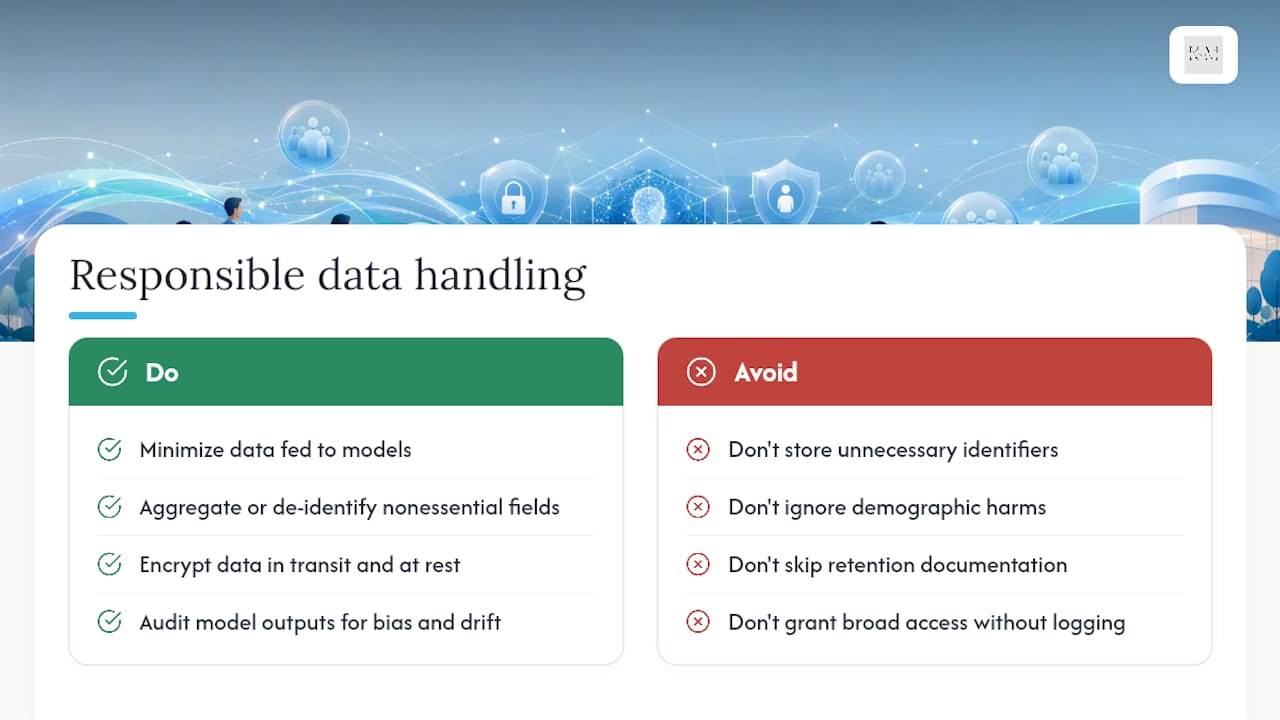
Minimize what you feed the model. Aggregate or de-identify wherever the forecast doesn’t actually need patient-level granularity. A model predicting Tuesday morning volume for pediatric well visits doesn’t need a name attached to every row, just a category and a timestamp. Where identifiable data must flow through the pipeline, it needs the same safeguards as any other protected health information, encrypted in transit and at rest, access-logged, and restricted to the people actually building or auditing the model.
Be deliberate about demographic and behavioral features too. Age, insurance type, or referral source can sharpen a forecast, but they can also bake in historical inequities if a model learns to deprioritize slots for groups that have shown lower past attendance. Audit model outputs periodically for that kind of drift, not just for accuracy.
Document your data retention policy explicitly: how long raw appointment records feed the training set, when they get purged or aggregated, and who can request an accounting of how their data was used. A forecasting system built on a HIPAA-compliant foundation, with clear audit trails and access controls, isn’t just a compliance checkbox. It’s what lets clinical staff trust the numbers enough to act on them.
Why Most Forecasting Pilots Stall Before They Help Anyone
The biggest barrier isn’t the model, it’s messy data and the expectation that forecasting means perfect prediction. It doesn’t. It means better decisions under uncertainty.
Start with one clinic, one visit type, and a metric everyone already tracks, like fill rate. Show a quick win before asking schedulers to trust a dashboard over their gut. Align incentives so operations and front-desk staff both benefit when the forecast helps, not just the analyst who built it.
— Opinly
Get Your Forecasting Pipeline Built and Connected
Building the model is the easy half. The harder part is wiring forecasts into a booking system, a reminder sequence, and a staffing decision that a front-desk team actually follows. That’s where a lot of clinics stall, not on the math, but on the integration between a forecast and the software patients and staff interact with every day.
Klyrmedia builds that connective layer for independent pharmacies, clinics, and healthcare practices: HIPAA-compliant websites that capture clean booking data from the first click, predictive analytics that flag no-show risk before it costs you a slot, and automated follow-up sequences that turn a forecasted surge into filled chairs instead of an overwhelmed front desk. Unlike building this in-house, where clinics spend months assembling data pipelines before seeing a single operational change, Klyrmedia starts with a data audit of what you’re already capturing, builds a pilot forecast around one high-value visit type, and iterates the rollout based on what actually moves your fill rate. If your booking data is scattered across three systems that don’t talk to each other, that’s the first problem worth solving. Get in touch through Klyrmedia’s clinic solutions page to scope a pilot for your practice.
Sources
- Demand Forecasting: Evidence-based methods and their use — Armstrong & Green
- Dynamic appointment scheduling with forecasting and priority-specific access time service level standards — Lin et al.
- Machine Learning and Demand Forecasting reduce neurology patient wait times — Mayo Clinic ME&C
- clinic-forecasting-platform (GitHub)

